Setting up the Rust debugger with VS Code on Windows and Linux
When setting up the Debugger for Rust in VS Code you have two options depending on which operating system you are running on. The rust analyzer extension doesn’t support debugging out of the box you must install one of the following:
- C/C++ for Visual Studio Code - use with Windows
- CodeLLDB - use with Linux
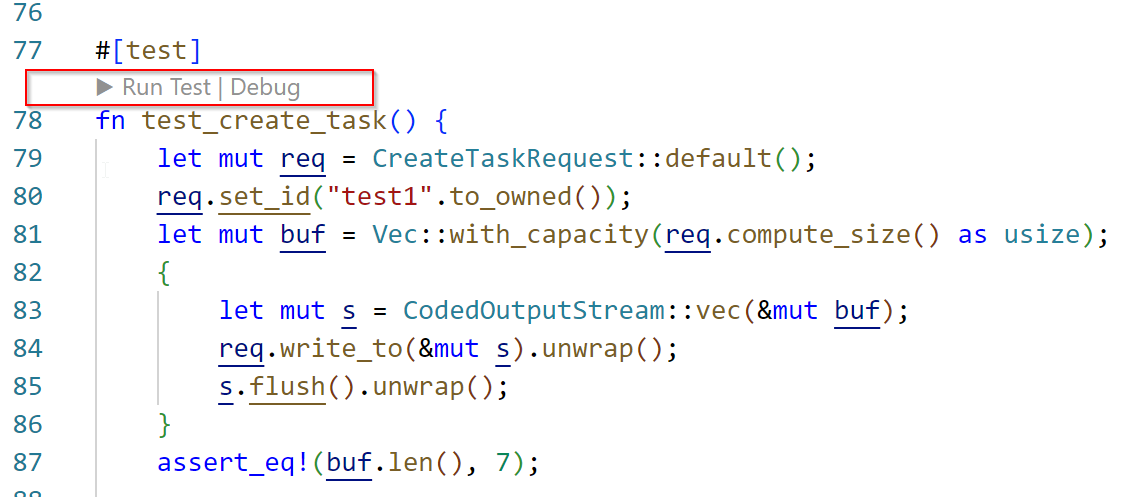
Once you have those installed, running tests and console applications are easy to get started with the debugger through the added meta data:
More advanced setup
Those work great for simply scenarios but what happens if you want to run your application with command line parameters or set environment variables? You will need to create a launch.json debugger configuration. The config needed will differ depending on if you are using the C/C++ for Windows or the CodeLLDB for linux.
CodeLLDB on Linux
Let’s look at the CodeLLDB configuration for Linux first as it is a a little simpler. The project this configuration works for is https://github.com/containerd/rust-extensions but should give you the idea of how to configure it for other projects.
{
    "version": "0.2.0",
    "configurations": [
        {
            "type": "lldb",
            "request": "launch",
            "name": "skeleton shim",
            "cargo": {
                "args": [
                    "build",
                    "--example",
                    "skeleton"
                ]
            },
            "args": [
                "-namespace",
                "default",
                "-id",
                "1234",
                "-address",
                "/var/run/containerd/containerd.sock",
                "-publish-binary",
                "./bin/containerd",
            ],
            "env": {
                "TTRPC_ADDRESS": "/var/run/containerd/containerd.sock.ttrpc"
            },
        }
    ]
}
As you can see, you can specify the cargo command and then add args and environment variables. Interestingly you need to specify build for the cargo command not run. The extension runs the debugger with the built binary not the cargo run command.
C/C++ for Visual Studio Code on Windows
The C/C++ for Visual Studio Code extension for Windows requires a little more configuration. The first is the debugging configuration:
{
    "version": "0.2.0",
    "configurations": [
        {
            "name": "(Windows) Launch",
            "type": "cppvsdbg",
            "request": "launch",
            "program": "${workspaceRoot}/target/debug/examples/skeleton.exe",
            "args": [
                "-namespace", "default",
                "-id", "1234",
                "-address", "\\\\.\\pipe\\containerd-containerd",
            ],
            "stopAtEntry": false,
            "cwd": "${workspaceRoot}",
            "environment": [
                {
                "name": "TTRPC_ADDRESS",
                "value": "\\\\.\\pipe\\containerd-containerd.ttrpc"
                }
            ],
            "preLaunchTask": "skeleton"
        }
    ]
}
This looks very similar but you can see there isn’t a cargo section. The extension doesn’t know about other tools such as cargo. You might notice instead of a cargo command we specified the path to an actual executable, but how the executable built?
The debugging extension doesn’t build the binary, it just attaches the debugger to the program specified. Building the binary is up to the user. You would need to call cargo build manually every time before running the debugger or you wouldn’t get your new changes. If you are anything like me, this could lead to some very loud debugging sessions.
But the careful observer might also notice that we care calling a preLaunchTask. This preLaunchTask is what calls cargo build for us every time, keeping us cool, calm and collected. Let’s take a look at what is in the preLaunchTask:
{
	"version": "2.0.0",
	"tasks": [
		{
			"type": "cargo",
			"command": "build",
			"args": [
				"--example",
				"skeleton"
			],
			"problemMatcher": [
				"$rustc"
			],
			"group": {
				"kind": "build",
				"isDefault": true
			},
			"label": "skeleton",
		}
	]
}
It’s our cargo build! The label skeleton is the name that we use in the debugger configuration above and let’s use tie the two together. This task can also be easily configured to run automatically or tied to a shortcut as well.
I don’t always use a debugger but when I do it saves a ton of time. It is especially useful for stepping through the complex code of a new project or finding bugs.
Happy debugging!
Comments