Accessing Azure Service Fabric Virtual Machines
Azure Service Fabric is a manage service that abstracts the server infrastructure away from you. You give Service Fabric the application composed of services and it decides what machines to run the individual services on (this can be customized on CPU/memory/etc via configuration. If a machine goes down it will automatically redistribute the loads, wait till the server comes back online then distribute the load evenly (or as configured). This all happens with out you noticing or any direct intervention.
During development you might mis-configure something and occasionally you might need to look at an individual server to diagnose an error. This happened to me the other day and I learned how access a unique server via Remote Desktop (RDP) to look at the log files. Full Azure Portal support for VM Scale Sets is still in the works. Here we will see how you can find the end points for your Virtual Machines and log in via Remote Desktop in the mean time.
Note: This is something that should be done as a last resort for debugging purposes only. The underlying infrastructure is abstracted away and making changes can negatively affect many things. Also as Scale Set support in the portal becomes more robust this will likely no longer be needed. Also if there is a better way make sure you leave a note in the comments.
Find your RDP end point for the machines
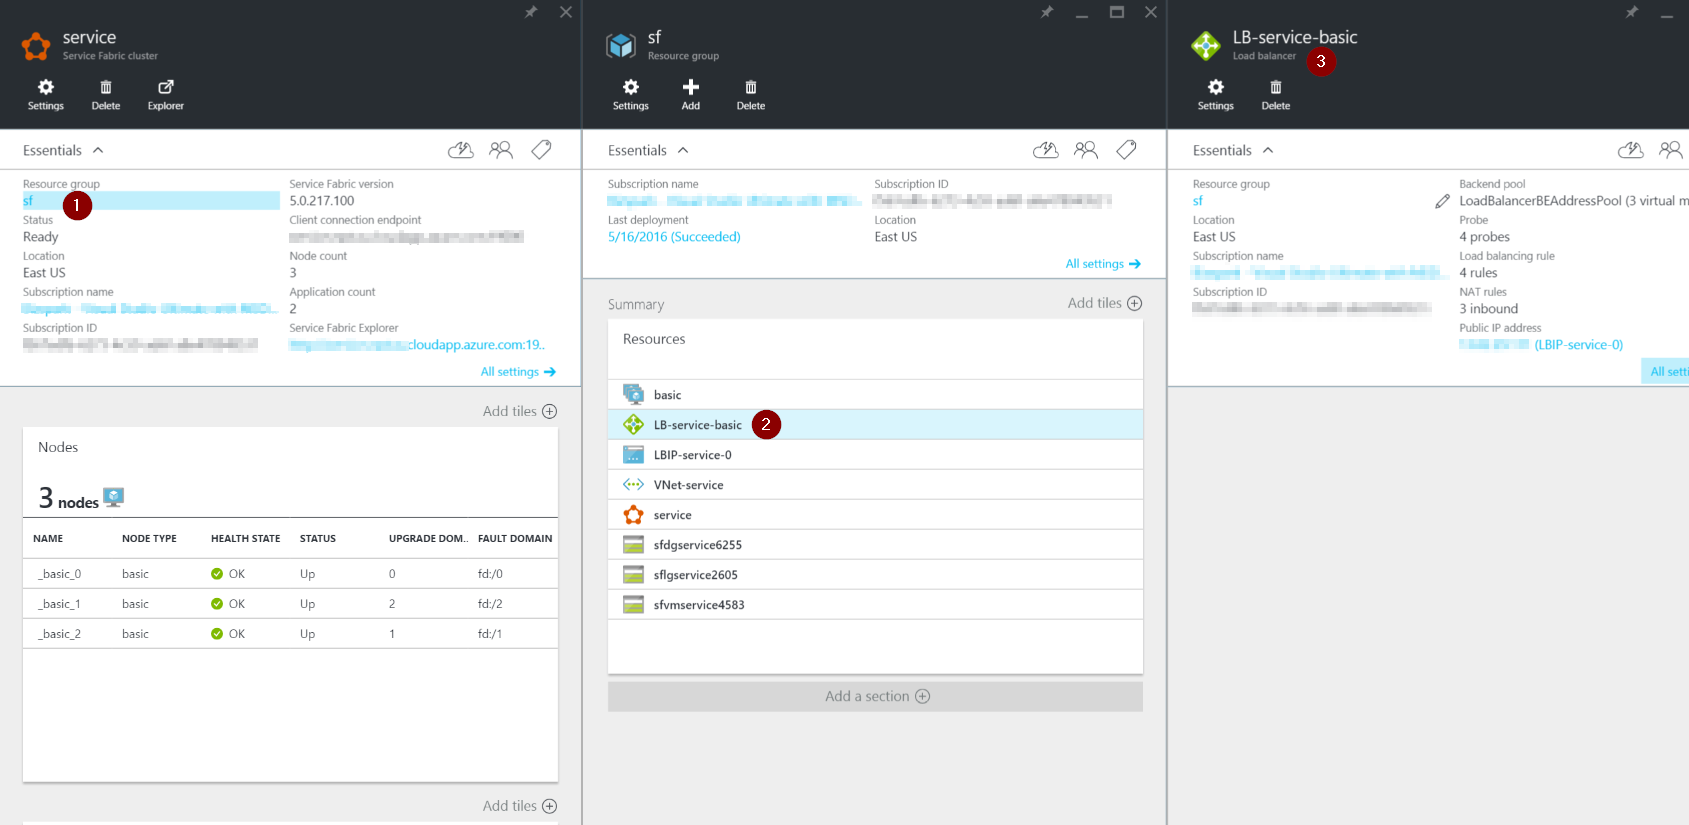
When you create a Azure Service Fabric Cluster a lot of services are scaffolded out for you. One of the services is the Load Balancer. This is where we will find the Inbound NAT Rules that correspond to the VM’s we have created. Using this we can determine the port we should connect to in order to RDP into the server.
First, navigate to your load balancer in the Azure Portal by opening your Service Fabric Cluster:
- Click on your Resource Group
- Click on the Load Balancer resource
- A pane should open that is labeled as “Load Balancer”
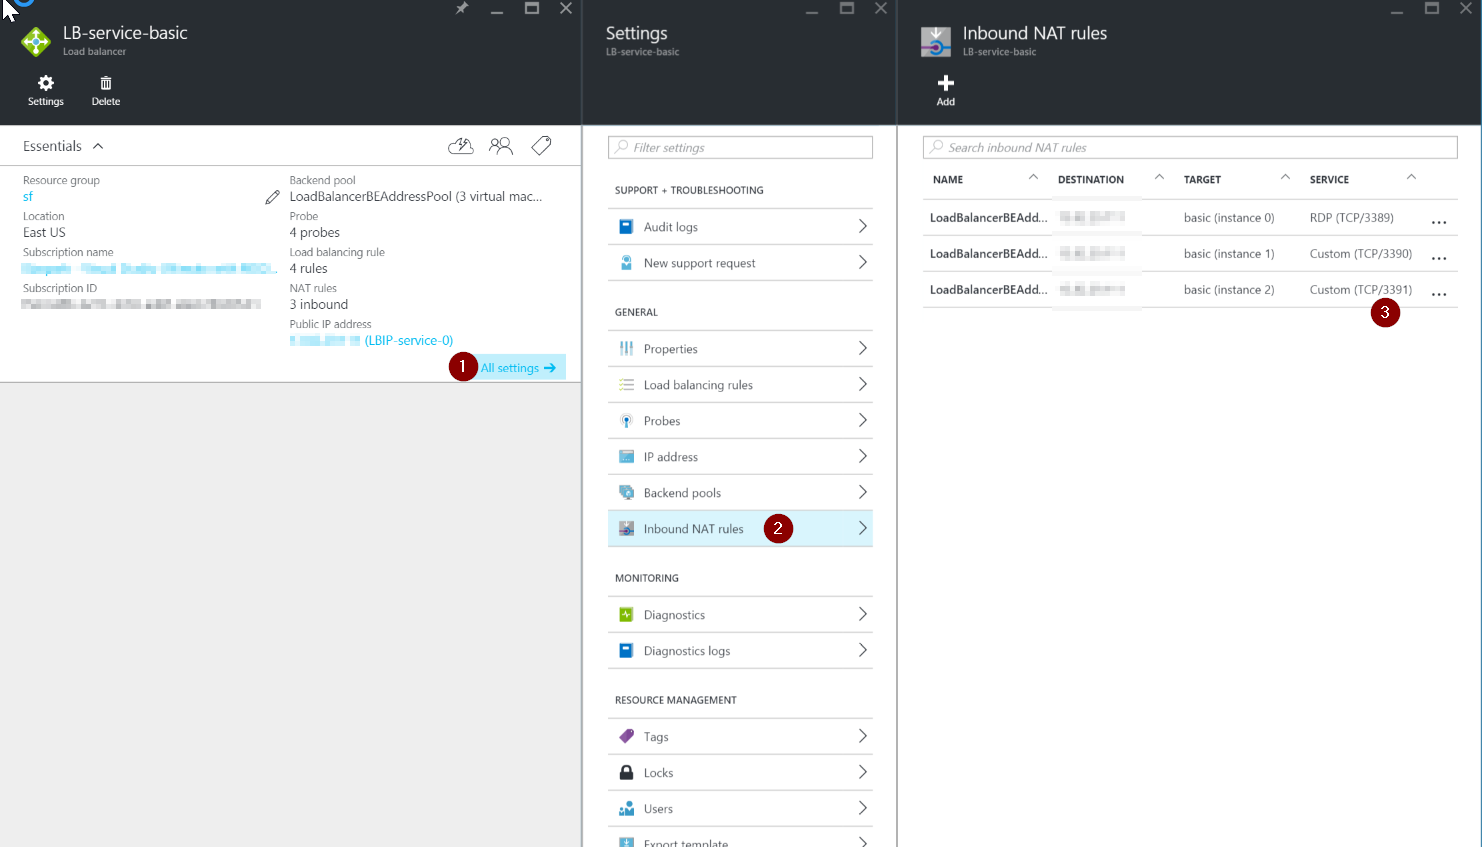
Next, navigate to the NAT rules to find the VM instances and the ports configured ports. If you know which instance is causing the issue (in my case the instance was marked as a failed instance in the portal) you can then find the instance under Target and the port under service. It seems to always start with 3389 and go up from there.
- Click All Settings
- Select Inbound NAT Rules
- Find the port number under
ServiceColumn
Open RDP and log in
Once you know your machines port number:
- Open the run dialog by typing
Windows key + R - Type
mstsc /v:<your-sf-cluster-name>.eastus.cloudapp.azure.com:<your port number> - Log into the machines using your user name and password that you created for the machines.
An example would be:
mstsc /v:samplesf.eastus.cloudapp.azure.com:3391
Comments