When deploying an Azure Kubernetes Service cluster you are required to use a service principal. This service principal is used by the Kubernetes Azure Cloud Provider to do many different of activities in Azure such as provision IP addresses, create storage disks and more. If do not specify a Service principal at the time of creation for the an AKS cluster a service principal is created behind the scenes.
In many scenarios, the resources your cluster will need to interact with will be outside the auto-generated node resource group that AKS creates. For instance, if you are using Static IP address for some of you services, the IP addresses might live in a resource group outside the auto-generated node resource group. Another common example is attaching to an existing vnet that is already provisioned.
Assigning proper permissions
It would be simple to give Contributor rights across your whole sub or even individual resource groups and these scenarios would work but this is not a good practice. Instead we should assign the specific, least privileged rights to a given service principal.
In the examples of attaching IP addresses, we may need the Azure Cloud Provider to be able to attach but not delete IP addresses because a different team controls the IP address. We definitely don’t want the Service principal to be able to delete any other resources in the resource group.
There is a good list of the Kubernetes v1.11 permissions required here. This list shows the permissions for creating a least privileged service principal (note that it might change as k8s version change so use as general guide). Using this we can assign just enough rights to the service principal to interact with the resources outside the node group.
Sample Walk through
I have created a full walk through sample of creating the service principal upfront and assign just enough rights to it to access the IP addresses and vnet. Here is a highlight of the important parts:
First create a service principal with no permission:
clientsecret=$(az ad sp create-for-rbac --skip-assignment-n$spname-o json | jq -r .password)
Using custom Role Definitions I am able to give the service principal only read access to the IP’s:
{"Name":"AKS IP Role","IsCustom":true,"Description":"Needed for attach of ip address to load balancer created in K8s cluster.","Actions":["Microsoft.Network/publicIPAddresses/join/action","Microsoft.Network/publicIPAddresses/read"],"NotActions":[],"DataActions":[],"NotDataActions":[],"AssignableScopes":["/subscriptions/yoursub"]}
Using that definition we can then apply the Role Definition to the Service principal which will give it IP read access to the resource group:
spid=$(az ad sp show --id"http://$spname"-o json | jq -r .objectId)iprole=$(az role definition create --role-definition ./role-definitions/aks-reader.json)
az role assignment create --role"AKS IP Role"--resource-group ip-resouce-group --assignee-object-id$spid
Then you can deploy your cluster using the service principal:
az aks create \
    --resource-group aks-rg \
    --name aks-cluster \
    --service-principal $spid \
    --client-secret $clientsecret
This will allow the Service principal used to access the the IP Addresses in the resource group outside the node.
note: to access the ip address in group outside the cluster you will need to provide an annotation on the k8s Service definition (service.beta.kubernetes.io/azure-load-balancer-resource-group). See the example.
Yesterday I had to revert to the command line to debug a program I was working on (long story as to why). I was initially apprehensive to debug from the command line but once I started I found the experience was quite nice. In fact I would compare debugging from the command line like “Vim for debugging”. Best part was I found the bug I was looking for!
I was working in Golang so I used the awesome tool Delve which is used by the VS Code Go extension. I didn’t find a simple tutorial on using the command line so I’ve created this to help me remember next time I need to fallback to the command line.
Install Delve (dlv)
The following steps assumes you have set up your go path.
dlv version
Delve Debugger
Version: 1.1.0
Build: $Id: 1990ba12450cab9425a2ae62e6ab988725023d5c $
Start Delve on a project
Delve can be run in many different ways but the easiest is to use dlv debug. This takes your current go package, builds it, then runs it. You can specify command parameters by using -- <application parameters> after the delve paramters you pass.
Get the example Go app and then start delve using the hello package:
$ go get github.com/golang/example/...
cd$GOPATH/src/github.com/golang/example/
# run delve$ dlv debug ./hello
Type 'help'for list of commands.
(dlv)
You have now built the app and entered the debugging experience. Easy enough if you are like me, you are wondering what’s next? With so many command how do I do start to do anything useful?
Navigating around at the command line
There are tons of commands you can run at this point but I like I like to start with just getting into application to see where I am and get started on the right foot. So let’s set a breakpoint (b is short for break):
(dlv) b main.main
Breakpoint 1 set at 0x49c3a8 for main.main() ./hello/hello.go:25
(dlv)
(dlv)c>main.main()./hello/hello.go:25(hitsgoroutine(1):1total:1)(PC:0x49c3a8)20:"fmt"21:22:"github.com/golang/example/stringutil"23:)24:=>25:funcmain(){26:fmt.Println(stringutil.Reverse("!selpmaxe oG ,olleH"))27:}(dlv)
Whoa! Now we hit the break point and can even see the code. Cool! This is fun lets keep going by stepping over the code (n is short for next):
(dlv)n>main.main()./hello/hello.go:26(PC:0x49c3bf)21:22:"github.com/golang/example/stringutil"23:)24:25:funcmain(){=>26:fmt.Println(stringutil.Reverse("!selpmaxe oG ,olleH"))27:}
Nice, now we can see that we have stepped to the next line of code. Now there isn’t much to this code but we can see that we do have a package called stringutil that we are using to reverse the string. Let’s step into that function (s is short for step):
(dlv)s>github.com/golang/example/stringutil.Reverse()./stringutil/reverse.go:21(PC:0x49c19b)16:17:// Package stringutil contains utility functions for working with strings.18:packagestringutil19:20:// Reverse returns its argument string reversed rune-wise left to right.=>21:funcReverse(sstring)string{22:r:=[]rune(s)23:fori,j:=0,len(r)-1;i<len(r)/2;i,j=i+1,j-1{24:r[i],r[j]=r[j],r[i]25:}26:returnstring(r)(dlv)
Now we inside another package and function. Let’s inspect the variable that has been passed in (p is short for print):
(dlv) p s
"!selpmaxe oG ,olleH"(dlv)
Yup, that’s the string value we were expecting! Next let’s setting another breakpoint at line 24 and if we hit continue we should end up there:
(dlv)b24Breakpoint2setat0x49c24eforgithub.com/golang/example/stringutil.Reverse()./stringutil/reverse.go:24(dlv)c>github.com/golang/example/stringutil.Reverse()./stringutil/reverse.go:24(hitsgoroutine(1):1total:1)(PC:0x49c24e)19:20:// Reverse returns its argument string reversed rune-wise left to right.21:funcReverse(sstring)string{22:r:=[]rune(s)23:fori,j:=0,len(r)-1;i<len(r)/2;i,j=i+1,j-1{=>24:r[i],r[j]=r[j],r[i]25:}26:returnstring(r)27:}(dlv)
Sweet, but what’s the values for i, j, and even r? Let’s inspect the locals:
(dlv) bp
Breakpoint unrecovered-panic at 0x42a7f0 for runtime.startpanic() /usr/local/go/src/runtime/panic.go:591 (0)
print runtime.curg._panic.arg
Breakpoint 1 at 0x49c3a8 for main.main() ./hello/hello.go:25 (0)
Breakpoint 2 at 0x49c24e for github.com/golang/example/stringutil.Reverse() ./stringutil/reverse.go:24 (0)(dlv) clearall main.main
Breakpoint 1 cleared at 0x49c3a8 for main.main() ./hello/hello.go:25
(dlv)
Alright if you’re like me your feeling pretty good but are you ready to get fancy? We know the name of the function we want to jump to so let’s search for the function name, set a breakpoint right were we want it, then execute to it:
(dlv) funcs Reverse
github.com/golang/example/stringutil.Reverse
(dlv) b stringutil.Reverse
Breakpoint 3 set at 0x49c19b for github.com/golang/example/stringutil.Reverse() ./stringutil/reverse.go:21
(dlv) c
> github.com/golang/example/stringutil.Reverse() ./stringutil/reverse.go:21 (hits goroutine(1):1 total:1)(PC: 0x49c19b)
16:
17: // Package stringutil contains utility functions for working with strings.
18: package stringutil
19:
20: // Reverse returns its argument string reversed rune-wise left to right.
=> 21: func Reverse(s string) string {
22: r :=[]rune(s)
23: for i, j := 0, len(r)-1; i < len(r)/2; i, j = i+1, j-1 {
24: r[i], r[j] = r[j], r[i]
25: }
26: return string(r)(dlv)
(dlv)c>github.com/golang/example/stringutil.Reverse()./stringutil/reverse.go:24(hitsgoroutine(1):1total:1)(PC:0x49c24e)19:20:// Reverse returns its argument string reversed rune-wise left to right.21:funcReverse(sstring)string{22:r:=[]rune(s)23:fori,j:=0,len(r)-1;i<len(r)/2;i,j=i+1,j-1{=>24:r[i],r[j]=r[j],r[i]25:}26:returnstring(r)27:}(dlv)plen(r)-118(dlv)
Everything looks fine, so I guess I work is done here:
That just touched the surface of what you can do but I hope it made you more comfortable with debugging on the command line. I think you can see how fast and efficient you can be. Good luck on you bug hunting!
NOTE: This project is no longer actively maintained and some of the information might be outdated. Please checkout KEDA. The scenarios described below have been ported to that project.
I currently work for an awesome team at Microsoft called CSE (Commercial Software Engineering), where we work with customers to help them solve their challenging problems. One of the goals of my specific team inside CSE is to identify repeatable patterns our customers face. It is a challenging, but rewarding role where I get to work on some of the most interesting and cutting edge technology. Check out this awesome video that talks about how my team operates.
While working with customers at a recent engagement, I recognized a repeating pattern with in the monitoring solutions we were implementing on Azure Kubernetes Service (AKS) with customers. We had 5 customers in the same room and 3 of them wanted to scale on custom metrics being generated by their applications. And so the Azure Kubernetes Metric Adapter was created.
Why do we need the Azure Kubernetes Metric Adapter
Two of the other customers were not using Prometheus, instead they using Azure services such as Azure Monitor, Log Analytics and Application Insights. At the engagement, one of the customers started to implement their own custom scaling solution. This seemed a bit repetitive as the other customer where not going to be reuse there solution. And so Azure Kubernetes Metric Adapter was created.
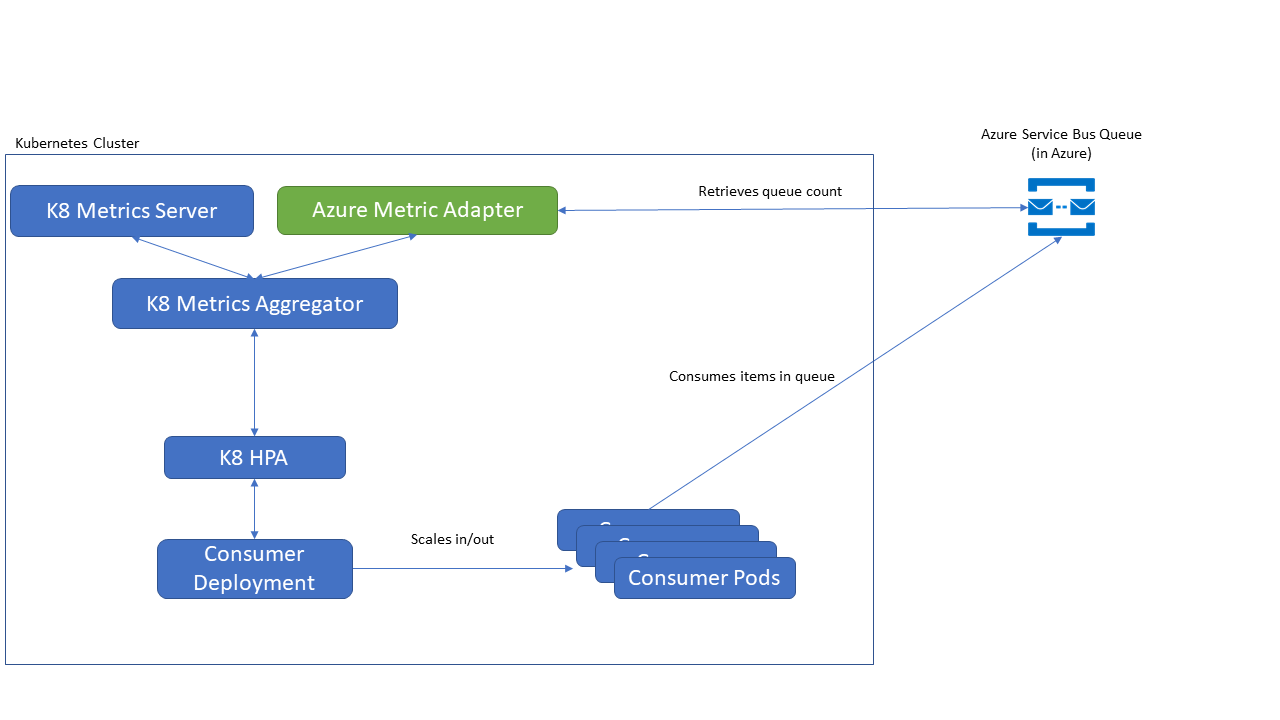
That is a bit of a mouth full so let’s take a look at wha the solution looks like when deployed onto your cluster:
The Azure Metric Adapter is deployed onto you cluster and wired up the Horizontal Pod Autoscaler (HPA). The HPA checks in periodically with the Adapter to get the custom metric defined by you. The adapter in turn calls to an Azure endpoint to retrieve the metric and give it back to the HPA. The HPA then evaluates the value and compares it to the target value you have configured for a given deployment. Based on an algorithm the HPA will either leave you deployment alone, scale up the pods or scale them down.
As you can see you there is no custom code needed to scale with custom or external metrics when using the Adapter. You deploy the Adapter, configure an HPA and the rest of the scaling is taken care of by Kubernetes.
There are two main scenarios that have been addressed first and you can see a step by step walk through for each, though you can scale on any Application Insights metric or Azure Monitor Metric.
And your that’s it to enable auto scaling on External Metric. Checkout the samples for more examples.
Wrapping up
Hope you enjoy the Metric Adapter and can use it to scale your deployments automatically so you can have more time to sip coffee, tea, or just read books. Please be sure to report any bugs, features, challenges you might have with it.
I was recently working on a project where we using AKS shortly after it went General Availability (GA). We saw strange behavior on our test cluster related to provisioning volume mounts and load balancers that we could not reproduce with newly created clusters. We checked the version numbers on Kubernetes/code/images but we could not find anything different between the clusters.
We finally found that there was a difference between acs-engine versions of the clusters. This happened because the customer had created the cluster before the GA date. Recreating the cluster (and therefor getting the latest changes from acs-engine) fixed many of the inconsistencies we were seeing in the cluster with issues.
To check an AKS cluster acs-engine version number:
# find the generated resource group name
az group list -o table
Name Location Status
--------------------------------------------
MC_vnet_kvnet_eastus eastus Succeeded
vnet eastus Succeeded
# find a node name for that group
az vm list -g MC_vnet_kvnet_eastus -o table
Name ResourceGroup Location Zones
-------------------------------------------------------------
aks-agentpool-8593-0 MC_vnet_kvnet_eastus eastus
aks-agentpool-8593-1 MC_vnet_kvnet_eastus eastus
aks-agentpool-8593-2 MC_vnet_kvnet_eastus eastus
# list the tags to see the acs-version number
az vm show -n aks-agentpool-8593-0 -g MC_vnet_kvnet_eastus --query tags
# output{"acsengineVersion": "0.16.2",
"creationSource": "aks-aks-agentpool-8593-0",
"orchestrator": "Kubernetes:1.9.6",
"poolName": "agentpool",
"resourceNameSuffix": "8593"}
Being able to compare the version numbers helped pinpoint the issue but the bigger lesson learned is to always recreate your Azure resources after a product goes GA. There are a lot of changes, fixes and releases that happen in the weeks leading up to a product release in Azure and the best way to make sure your running the latest software is to create a resource after the GA event.
I have been using windows containers a lot in the last month and the other day I was asked how to do something. I don’t remember anything, I use a combination of GitHub, OneNote, and Bingle (Bing/Google) for that, so of course I started looking for the various examples in various GitHub repo’s that I’ve used and written. Turns out this is not very efficient.
Instead, I am going to create this living document as a Windows Container Cheat Sheet (this blog is on GitHub so you can submit a PR if I missed anything you think is useful). It will serve as a quick reference for myself but hopefully can help beginners get a lay of the land.
Windows ServerCore - Use for legacy Applications (Lift and Shift). Includes full .NET framework, and can run IIS. Large Container size (10+ GB’s)
Windows Nano Server - Use for Cloud-First Applications. Small version (100’s of MB)
Windows Container Versions
To increase the speed of improvements and releases the team had to make breaking changes between versions. This means you have to match the host machine version to the container version. If you upgrade your host machine you can run older version of containers in Hyper-v mode.
Long Term Support Channel (ltsc) - supported for 5 years from release
Semi-Annual Channel (sac) - supported for 18 months from release
The current version’s are:
Windows Server 2016 (ltsc)
Windows Server 1709 (sac)
Windows Server 1803 (sac)
Note: if you are running nanoserver it only has the Semi-Annual Channel Release (sac)
When using the containers it is always a good idea to explicitly tag the images to a version an example below (choose the latest from tags on servercore and nanoserver):
# for an image with a specific patch in 1709FROM microsoft/nanoserver:1709_KB4043961# for an image with a specific path in 2016FROM microsoft/nanoserver:10.0.14393.1770
Development Resources and Tips
There are also sorts of tricks and tips that you can use. For examples, you should checkout:
Given nanoserver doesn’t have full dotnet framework and 1709 doesn’t ship with powershell but you can leverage multistage builds to do fancier things (like use powershell) then ship a smaller container:
FROMmicrosoft/windowsservercore:1709asbuilderRUN Write-Host 'Use Powershell to download and install';## ship a smaller containerFROM microsoft/nanoserver:1709COPY --from=builder /app /appCMD ["yourapp.exe"]
List of commands to run to see various state of your container. There is no UI so here are a few commands to get you started.
List process and Service running in container
Get-serviceList-processes
Get Event Log
# this shows source as 'Docker' but can change you 'Application' or customGet-EventLog-LogNameApplication-SourceDocker-After(Get-Date).AddMinutes(-5)|Sort-ObjectTime# can also store in variable to see message detail$el=Get-EventLog-LogNameApplication-SourceDocker|Sort-ObjectTime$el[0].Message
Networking information
Figuring out open ports and assigned ip addresses.